Log Analytics & Alerts
Azure Log Analytics and Alerts offer a powerful way for DevOps teams to stay informed, act quickly, and maintain healthy systems. From proactive issue detection to automated responses, these tools keep your operations smooth and reliable.
What is Log Analytics?
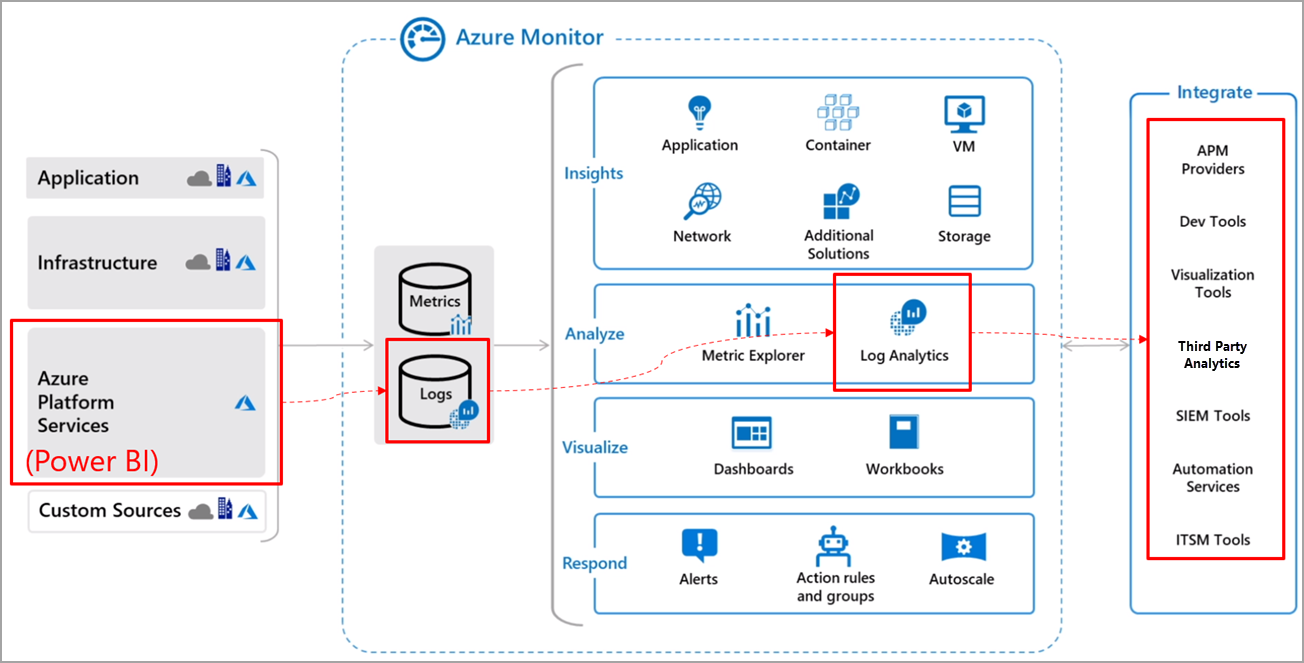
Azure Log Analytics is your command center for logs. It collects and centralizes data from virtual machines, applications, containers, and more—giving you the ability to query, visualize, and act on what's happening inside your infrastructure.
- Centralized Logging: View logs from across environments in one workspace.
- Powerful Queries with KQL: Use Kusto Query Language to search, filter, and analyze data efficiently.
- Security & Compliance: Detect anomalies, suspicious activity, and unauthorized access.
- Application & System Health: Monitor performance issues like slow response times or crashes.

Azure Log Analytics in action — centralized visibility into your logs
What Are Azure Alerts?
Azure Alerts let your systems talk to you. They monitor key metrics and logs, then notify you or trigger actions when things go wrong—or even before they do.
- Threshold Alerts: Automatically detect when metrics like CPU, memory, or response time go beyond safe limits.
- Log Alerts: React to specific log patterns like exceptions, login failures, or unusual events.
- Multi-Channel Notifications: Send alerts via email, SMS, Teams, Slack, or PagerDuty.
- Automated Recovery: Trigger scripts or scale out services to fix problems before users notice.
How to Set Up Log Analytics & Alerts
Here’s a step-by-step flow to start capturing logs and reacting to them intelligently:
- Create a Log Analytics Workspace: Go to Azure Portal → Monitor → Log Analytics Workspaces → Create.
- Connect Resources: Link Azure services, VMs, AKS, and App Services to the workspace.
- Write KQL Queries: Use the log editor to analyze events, errors, and performance trends.
- Create Alert Rules: Define conditions (e.g., CPU > 75%) and choose the monitored resource.
- Set Action Groups: Configure notifications, automation scripts, or webhooks.
- Automate Responses: Tie alerts to actions—restart services, scale instances, or notify support.
Example YAML Snippet for Azure Alerts
steps:
- task: AzureMonitorAlerts@1
  inputs:
    azureSubscription: 'MyAzureSubscription'
    resourceGroupName: 'MyResourceGroup'
    alertRuleName: 'HighMemoryUsage'
    conditionOperator: 'GreaterThan'
    conditionThreshold: '75'
    actionGroup: 'DevOpsTeamAlerts'
Best Practices for Using Log Analytics & Alerts
- Retain Logs Smartly: Set retention policies that meet compliance without excessive storage cost.
- Make Alerts Actionable: Avoid alert fatigue by fine-tuning thresholds and suppressing noise.
- Integrate with DevOps Tools: Pipe alerts into Azure Boards, ServiceNow, or Jira for visibility.
- Enable Auto-Healing: Use alerts to restart services or scale apps when performance drops.
- Review & Tune Regularly: Periodically audit alerts to ensure relevance and accuracy.
With Azure Log Analytics and Alerts, your team doesn’t need to wait for problems to escalate. You’ll have the visibility and tools to detect, investigate, and act—fast. Monitoring becomes proactive, not reactive.
Next up: Dive into how Azure Dashboards and Workbooks give your team real-time insight into everything that matters.