Troubleshooting & Debugging in Azure
Troubleshooting and debugging in Azure is a critical part of maintaining reliable and performant applications. Whether you're dealing with a failed deployment or tracking down a slow-loading page, Azure provides the tools you need to find and fix issues fast.
Common Issues in Azure Deployments
Azure-hosted applications may encounter a variety of challenges depending on the configuration, workload, or environment. Some of the most frequently seen issues include:
- Deployment Failures: Misconfigured pipelines, missing files, or incorrect environment variables.
- Application Crashes: Errors such as null references, unhandled exceptions, or memory exhaustion.
- Performance Degradation: Long response times due to inefficient database queries, caching issues, or CPU bottlenecks.
- Networking Problems: Misconfigured DNS records, VNet rules, or NSG/Firewall restrictions.
- Authentication & Authorization Errors: Invalid or expired tokens, RBAC misconfigurations, or identity provider integration issues.

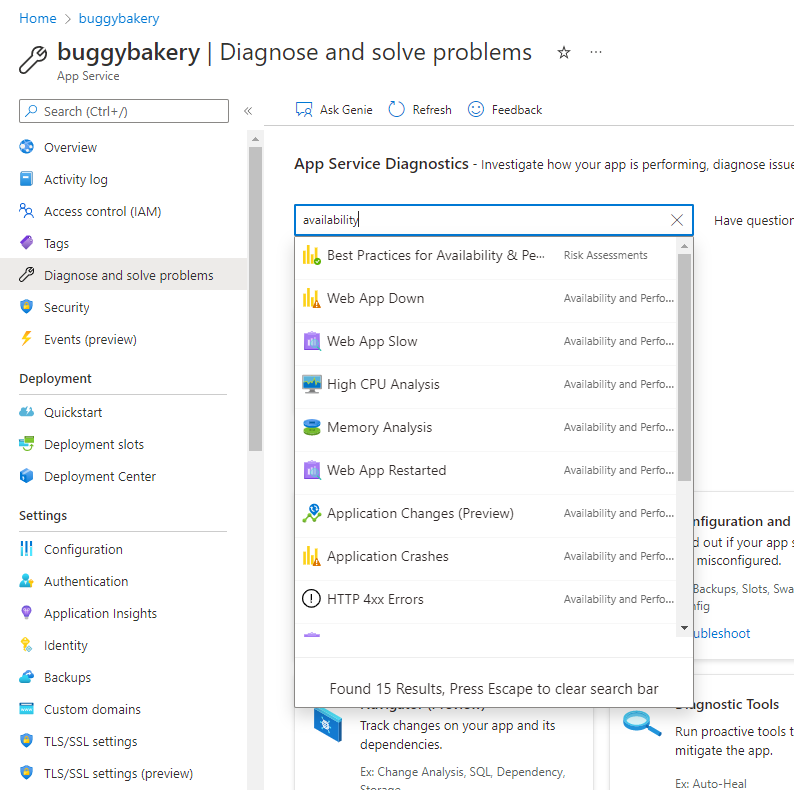
Powerful Azure tools to troubleshoot and resolve application issues
Key Tools for Troubleshooting & Debugging
Azure comes with a powerful toolbox designed for visibility and diagnostics:
- Azure Monitor: Tracks metrics like CPU, memory, and disk usage to highlight bottlenecks.
- Application Insights: Provides real-time telemetry, tracing, and error logging for your applications.
- Log Analytics: Centralizes logs across services for easy querying and troubleshooting using KQL.
- Kudu Console: A handy diagnostic tool for Azure App Services—lets you browse files, inspect logs, and run commands directly.
- Network Watcher: Analyzes connection issues and helps validate network routes, NSG rules, and flow logs.
- Azure Security Center: Identifies security risks and suggests remediations for infrastructure and apps.
Step-by-Step Debugging Workflow
Here’s a structured approach to resolving issues efficiently:
- Check Deployment Logs: Start by reviewing Azure DevOps build/release logs for errors.
- Use Application Insights: Pinpoint exceptions, failed requests, and performance metrics in real-time.
- Monitor System Metrics: Use Azure Monitor to inspect resource usage (CPU, memory, disk).
- Validate Network Settings: Run diagnostics with Network Watcher to catch misrouted or blocked traffic.
- Debug Locally: Try replicating the issue in a local dev or staging environment to isolate the cause.
- Enable Detailed Diagnostics: Turn on App Service diagnostics to get comprehensive event logs.
- Set Up Alerts: Automate alerting for error rates, response times, or threshold breaches.
Example YAML for Enabling Application Insights in CI/CD
stages:
- stage: Deploy
  jobs:
  - job: DeployWithMonitoring
    steps:
    - task: AzureAppServiceSettings@1
      inputs:
        azureSubscription: 'MyAzureSubscription'
        appName: 'MyWebApp'
        appSettings: '[{"name":"APPINSIGHTS_INSTRUMENTATIONKEY", "value":"$(ApplicationInsightsKey)"}]'
Best Practices for Troubleshooting in Azure
- Enable Rich Diagnostics: Turn on application, HTTP, and server logs for deeper insights.
- Use Live Metrics Stream: Monitor real-time performance and incoming requests without delay.
- Implement Resilience Patterns: Use retry policies, circuit breakers, and timeout strategies.
- Set Up Auto-Healing: Restart app services based on specific error conditions or response thresholds.
- Regularly Audit Alerts: Avoid alert fatigue by tuning thresholds and disabling noise-generating alerts.
By using Azure’s built-in monitoring and diagnostics tools, you can proactively identify and resolve issues before they impact users. Whether you're dealing with failed deployments, service interruptions, or performance degradation, a structured troubleshooting approach will help keep your systems healthy and your teams productive.